

Case Study 03
WhereIsWater
Turning satellite observations into long-term flood-frequency intelligence
Operational identification of recurrently flooded karst landscapes
using Sentinel-1 observations from 2015–2024.
What this case study shows
Fast flood detection
Near real-time mapping to capture floods as they unfold.
EO-based mapping
Reliable flood extent from Sentinel imagery and proven methods.
Multi-date comparison
Compare events over time to assess change and trends.
Better decisions
Support emergency response, planning and recovery efforts.
The Challenge
When static land classifications do not reflect recurring floods
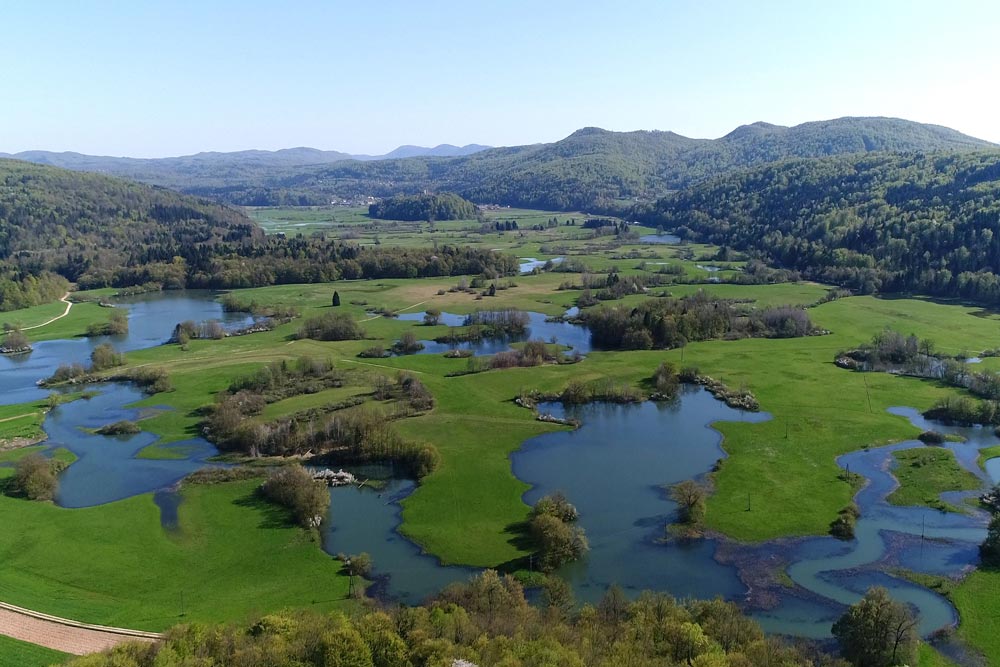
Intermittent karst lakes are among the most flood-prone agricultural
landscapes in Slovenia. Water can repeatedly appear in the same areas
within short time periods, while remaining absent for much of the year.
This dynamic behaviour creates uncertainty for farmers and
decision-makers. Static agricultural land classifications often do not
reflect the true frequency of flooding.
!
A consistent, objective and long-term view of flood occurrence was needed.
How WhereIsWater works
From satellite observation to flood-frequency information
01
Sentinel-1 SAR
Radar imagery detects surface water under all weather conditions.
02
Water detection
Surface-water detections are generated automatically for each acquisition.
03
Water masks
Individual water detections are converted into consistent water masks.
04
Long-term archive
Detections are stored in a national water-occurrence archive.
05
Flood frequency
Detections are aggregated across the full time series to calculate flood frequency.
06
Validation
Results are checked using optical imagery, weather data and national flood records.
This workflow ensures consistency, repeatability and scalability.
Results and impact
Results across three landscapes
Flood-frequency mapping was applied to Radensko polje, Planinsko polje
and the Ljubljana Marsh, supporting consistent differentiation between
frequently and occasionally flooded land.
Radensko Polje
Total analysed area
1,496.62 ha
Biggest single flooding event
186.48 ha
Flooded at least twice
198.71 ha
Flooded 4+ times
117.90 ha

Detected flood extent examples.
Blue areas represent detected surface water.
Key observation
Flooding is concentrated in well-defined depressions, clearly
identifying recurrent inundation zones and distinguishing them
from land affected only by rare events.
Planinsko Polje
Total analysed area
983.7 ha
Biggest single flooding event
744.27 ha
Flooded at least twice
842.54 ha
Flooded 4+ times
772.07 ha

Detected flood extent examples.
Blue areas represent detected surface water.
Key observation
Flood occurrence reflects karst hydrology and river backwater effects,
with recurrent inundation zones aligning with known hydrological pathways.
Ljubljana Marsh (Ljubljansko barje)
Total analysed area
13,505.13 ha
Biggest single flooding event
1,553.09 ha
Flooded at least twice
3,296.80 ha
Flooded 4+ times
1,465.01 ha

Detected flood extent examples.
Blue areas represent detected surface water.
Key observation
Flooding occurs frequently but unevenly. Water-occurrence mapping
reveals spatial differences between regularly flooded areas and land
affected mainly by extreme events.
From results to real-world use
Why the results matter
WhereIsWater turns repeated satellite observations into consistent
spatial evidence that can support land management, flood assessment
and long-term monitoring.
Why it matters
From episodic floods to actionable evidence
✓
Supports objective classification of agricultural land based
on actual flood exposure.
✓
Improves transparency in land-status and compensation assessments.
✓
Reduces ambiguity and disputes in flood-prone karst landscapes.
✓
Provides a nationally consistent framework for long-term monitoring.
Known limitations
Limitations and mitigation
Snow cover
Early- and late-season snow can occasionally be misclassified
as water. The analysis therefore focuses on April–November,
with April and November results manually verified.
Extreme rainfall
Intense precipitation can occasionally resemble surface water
in radar imagery. Suspected events are cross-checked using
meteorological and precipitation radar data.
Portability
A methodology that can be applied elsewhere
Because WhereIsWater operates nationally using routinely available
Sentinel-1 data, the methodology can be transferred to other areas
and long-term monitoring programmes.
Intermittent lakes, wetlands and fields
in other countries
in other countries
Flood-prone agricultural regions
Long-term land and water monitoring
programmes
programmes
Designed for continuous monitoring
The system supports continuous updates as new satellite observations
become available.
Validation example
Extreme rainfall event on 6 August 2017
The extreme weather event of 6 August 2017 produced the biggest
single flooding event detected on the Ljubljana Marsh during
the analysed ten-year period.
Meteorological and precipitation-radar information was used
alongside the satellite detections to better interpret the
observed water patterns.
Detected flood extent
1,553.09 ha
Why this matters
Cross-checking radar detections with meteorological information
helps identify and interpret unusual observations during
extreme rainfall events.
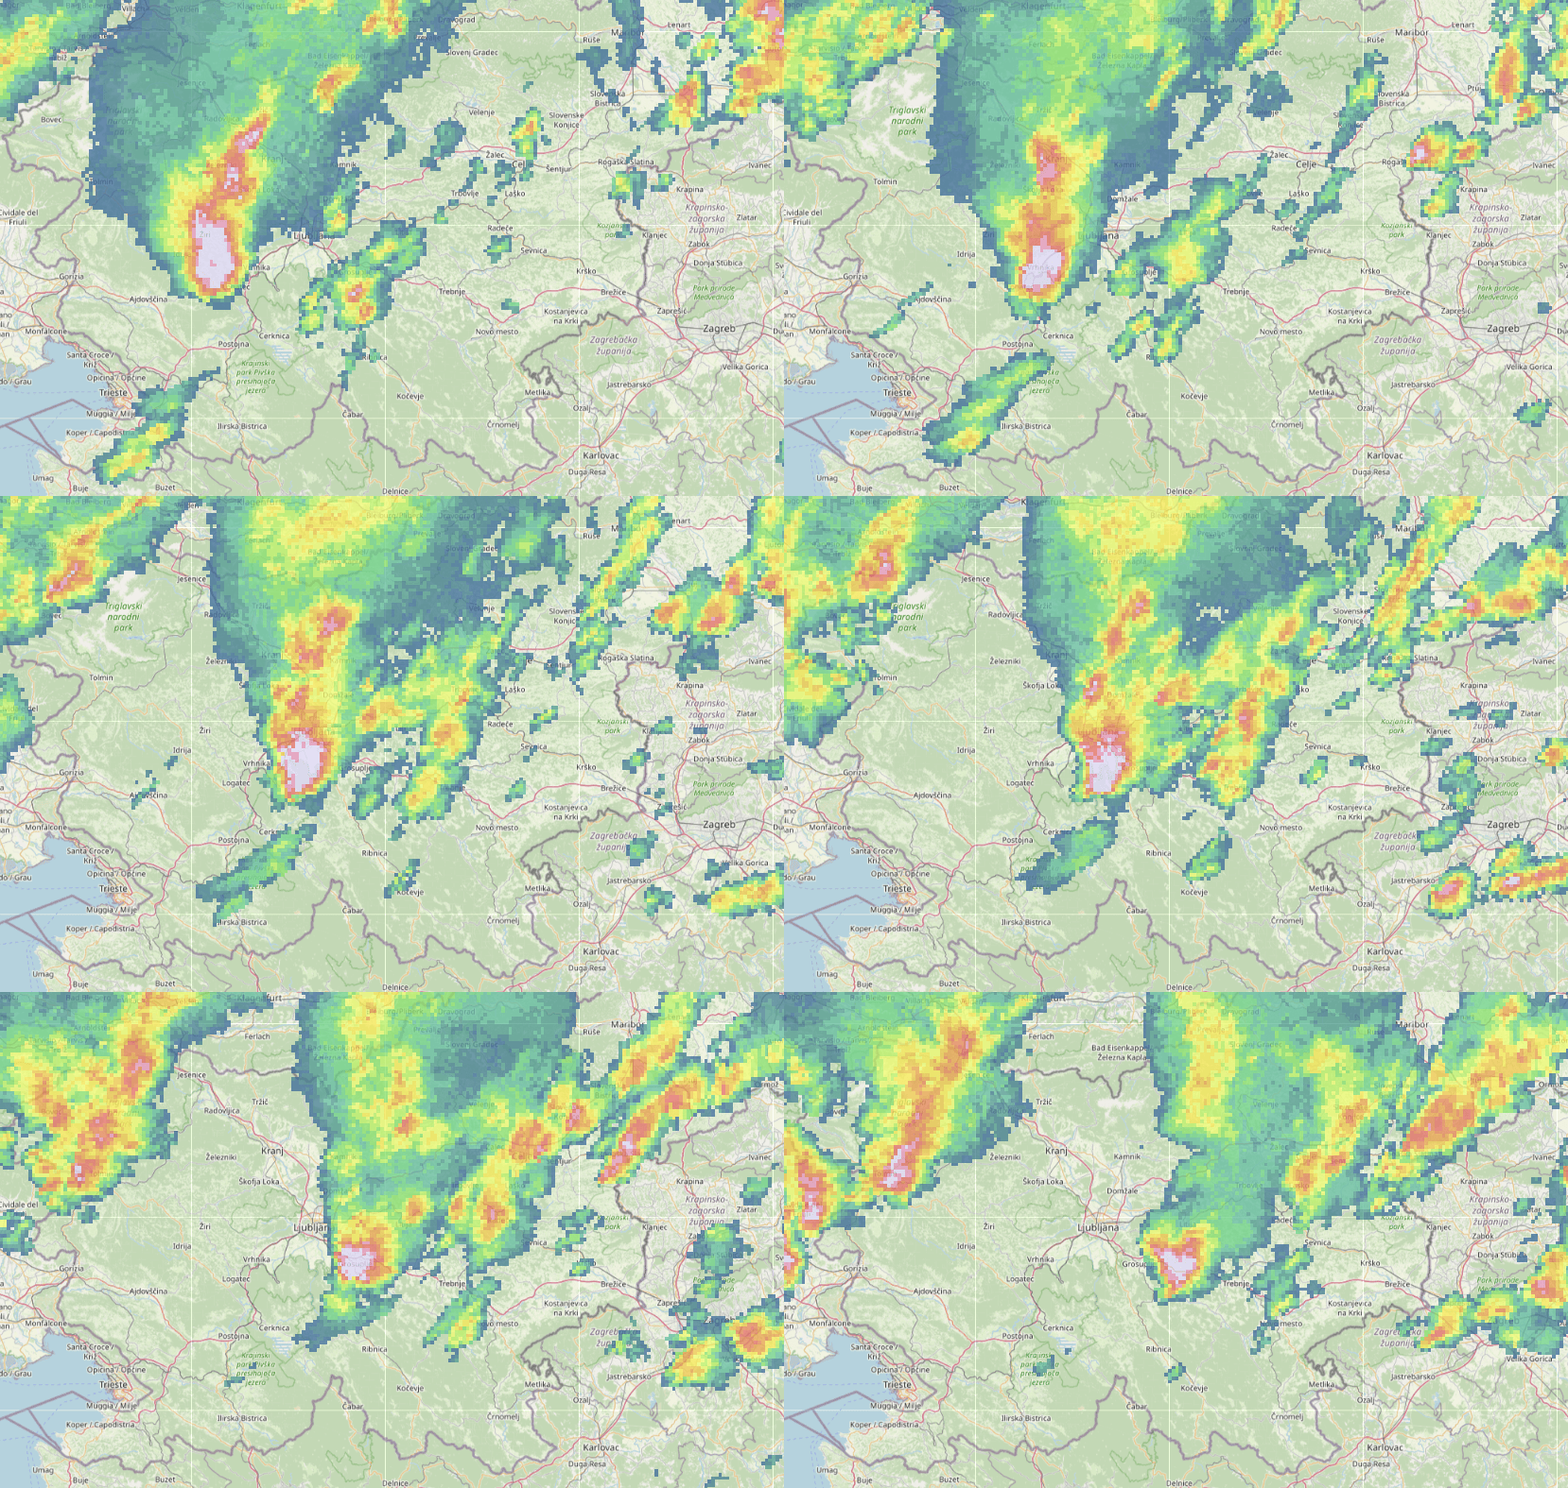
Extreme rain-flow event, 6 August 2017.
Detected water bodies correspond to rain-flow patterns observed
during the event.